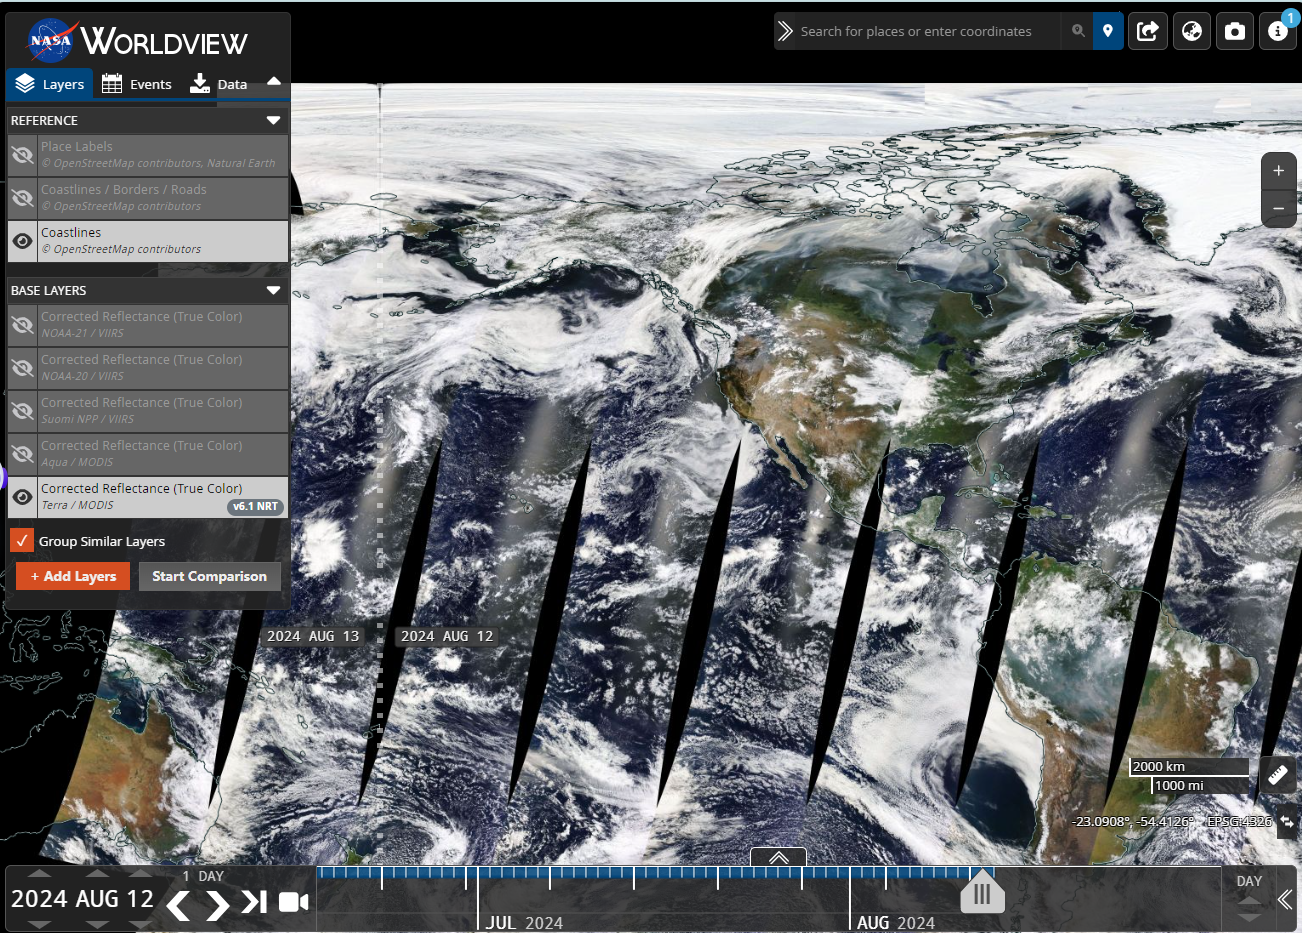
Remote sensing refers to non-contact, long-distance detection technology. It generally refers to the detection of the radiation and reflection characteristics of electromagnetic waves of objects using sensors/remote sensors. As an important earth observation technology, it provides the main data source for us to study and understand the earth's surface. At present, remote sensing data presents the coexistence of multi-source data such as high, medium and low resolution, multi-spectral, hyperspectral, SAR, street view and LiDAR laser point cloud, providing basic data guarantee for remote sensing monitoring and other multi-field applications.
The NASA satellite image data launched by CnOpenData mainly archives data related to clouds, water vapor and aerosols in the earth's atmosphere. The earth is divided into 18×36 grids, and the 10×10 degree grid is divided into 2400×2400 parts. The area of each part is 500×500m. The numbers represent the light brightness of the area, which can provide strong data support for related research.
Application Value
NASA satellite imagery data provides a wealth of information that helps us understand Earth's interconnected processes, develop innovative solutions to real-world challenges, and make data-driven decisions.
The main uses of the data are as follows:
- Air Quality: Poor air quality is one of the greatest environmental and health threats worldwide. This data provides methods to predict adverse air quality, track trace gases, visualize air quality trends, and predict the movement of pollutants.
- Agriculture and Water Management: NASA's land-based data, surface and groundwater data, and vegetation health data are available for agriculture and water managers, decision makers, and anyone interested in using this data to monitor crop yields and water availability.
- Biodiversity and Conservation: For ecologists, conservation managers, policymakers, and others interested in using the data to monitor biodiversity and predict changes in ecological communities, the data provides vegetation health, spectroscopy, and species distribution modeling data, as well as data for monitoring anthropogenic changes.
- Disasters: For emergency managers, policymakers, and anyone interested in using the data to understand community vulnerability and risk in disasters, the data can help monitor contributing factors, measure and mitigate risk, and assess post-event impacts.
- Diseases: While sensors on Earth-observing satellites cannot detect disease transmission from space, they provide long-term data records that help resolve, inform, and monitor many environmental variables that contribute to vectors, seasonality, and habitat suitability for transmission.
- Geographic Information Systems (GIS): A Geographic Information System (GIS) is a computer system used to analyze and display geographically referenced information from a variety of data sources to map and examine changes on Earth.
- Greenhouse Gases: Common greenhouse gas data are provided for researchers who need satellite, airborne, or ground-based data on climate warming gases. This data highlights data on carbon dioxide, methane, nitrous oxide, ozone, chlorofluorocarbons, and water vapor.
- Sea Level Change: For urban planners, policymakers, and others interested in using data to monitor changes and assess impacts and risks associated with sea level change. This data can help track changes in glaciers and ice sheets, ocean processes, land water storage, and other factors that contribute to sea level change.
- Water Quality: For water quality managers and researchers who can monitor local, regional, and global water bodies to help determine the impacts of water quality changes on ecosystems, people, and the environment, and to restore and protect coastal and surface waters.
Time interval
April 2012-2024
Sample data

Data update frequency
Annual update
