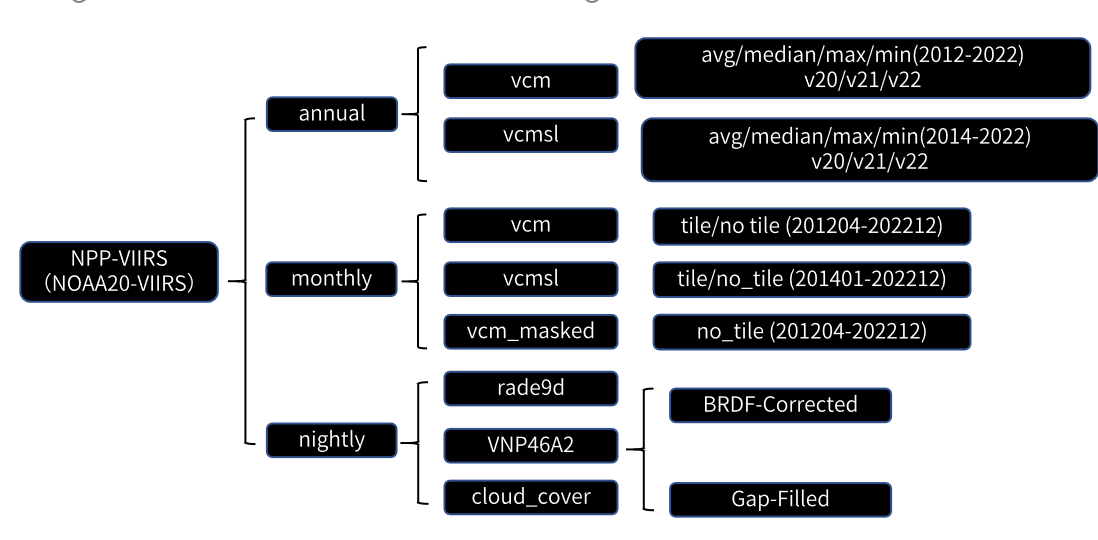
China's High-Quality Nighttime Light Data, collaboratively developed by CnOpenData and Jilin High-Resolution Remote Sensing Application Research Institute Co., Ltd, is derived from multi-source nighttime light satellite remote sensing imagery. Through scientific methodologies including denoising, correction, and analytical statistics, this database provides high-quality nighttime light data with annual and monthly updates, organized according to three-level administrative divisions (province, city, and county). The dataset comprises two formats: Excel statistical tables and SHP vector files, containing six key metrics: Total Brightness Value (总亮度值), Total Pixel Count (总像元数), Average Brightness Value (平均亮度值), Number of Light-Emitting Pixels (发光像元数), Average Brightness of Light-Emitting Pixels (发光像元平均值), and Proportion of Light-Emitting Pixels (发光像元占比).
This high-quality nighttime light dataset offers valuable insights into human activities and urban development, demonstrating significant implications for multiple domains:
- Urban Planning and Management: Reveals spatial distribution and expansion patterns of urban areas, enabling planners to optimize urban layouts and infrastructure development.
- Economic Research: Facilitates assessment of economic activity levels and growth trends through regional comparisons, supporting evidence-based resource allocation and policy formulation.
- Environmental Monitoring: Enables evaluation of energy consumption patterns, air quality, and population density by tracking urban light emissions.
- Disaster Monitoring and Response: Assists in assessing the spatial extent and severity of natural disasters (e.g., earthquakes, floods, wildfires) for timely emergency interventions.
- Social Science Research: Reveals spatiotemporal patterns of human activities through light distribution analysis, providing insights into urban social structures and cultural characteristics.
Temporal Coverage
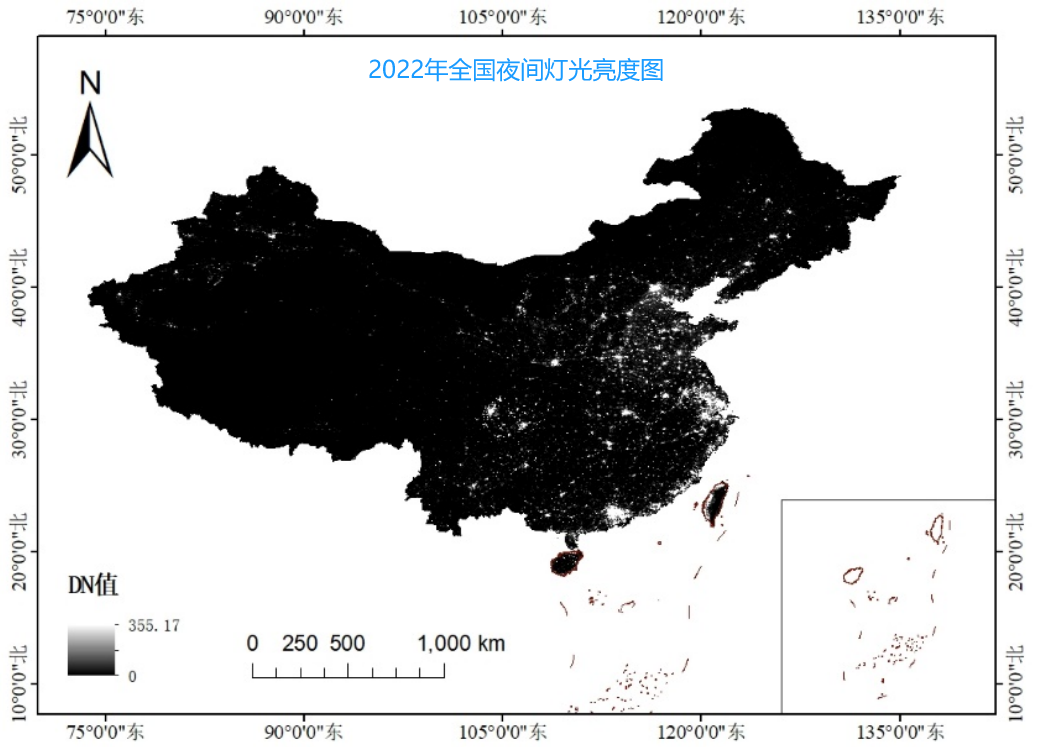
April 2012 - December 2023 (Spatial resolution: 500 meters)
Data Products
Data Description

Field Specifications
Sample Data
China Nighttime Light Data - Provincial Level
China Nighttime Light Data - Prefectural Level
China Nighttime Light Data - County Level
Update Frequency
Annual updates